


The pricing trick you’ve probably never heard of (But should totally use)
Use the Van Westendorp Pricing Meter to pinpoint what your customers really want to pay.

In this edition:
🔷 Why pricing feels so hard (even when you’ve done it before)
🔷 A simple 4-question method to get real-world pricing data
🔷 The 3 pricing thresholds that matter most
🔷 Where this model shines (and where it doesn’t)
We’re going to geek out on pricing today, but trust me. It’s going to be totally worth it.
Before we start, let’s agree on one thing:
Pricing is a strange beast.
It’s one of the few things in business that’s both art and science, and also where founders struggle the most (me included!).
Running Ruya Advisory, I’ve spent the past year helping founders with strategy, growth, and pitching.
But pricing my own services? Still tough.
Part of pricing is logical (costs, margin, market rates, etc.).
But then there’s the emotional piece: What will someone actually pay for this?
And then you go even deeper:
What kind of value are they perceiving from my solution?
Is price a motivator or an obstacle to a sale?
How do I maximize the revenue I can make out of my activity?
And when you’re just starting out, all of this can be OVERWHELMING.
You could end up feeling pretty isolated in having to answer these questions.
“Where do I even start?” was a question I frequently asked.
Well, until I came across something surprisingly practical: the Van Westendorp Pricing Sensitivity Meter.
Stick with me.
Meet The Van Westendorp Model
This model is simple, directional, and just smart enough to give you clarity without paralysis.

Here’s how to run it for your startup.
1. Collect data:
Send these four simple but powerful questions to your target customers:
At what price would this product be too cheap to trust its quality?
At what price would it be a bargain (great value for money)?
At what price would it be expensive but still worth it?
At what price would it be too expensive to consider?
2. Pinpoint the intersections:
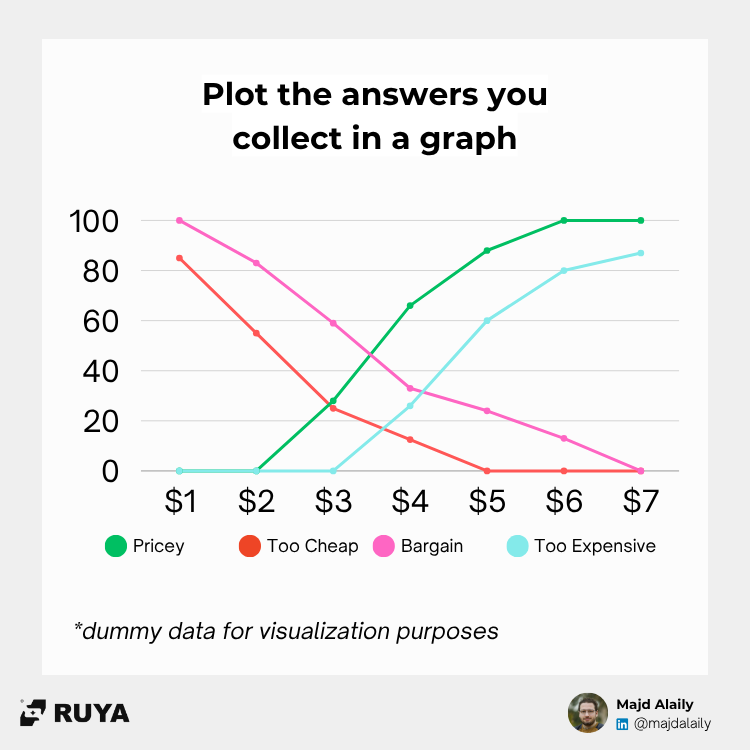
Once you collect responses, plot them on a graph.
Four trend lines will emerge, one for each question.
These lines intersect and reveal three key points:
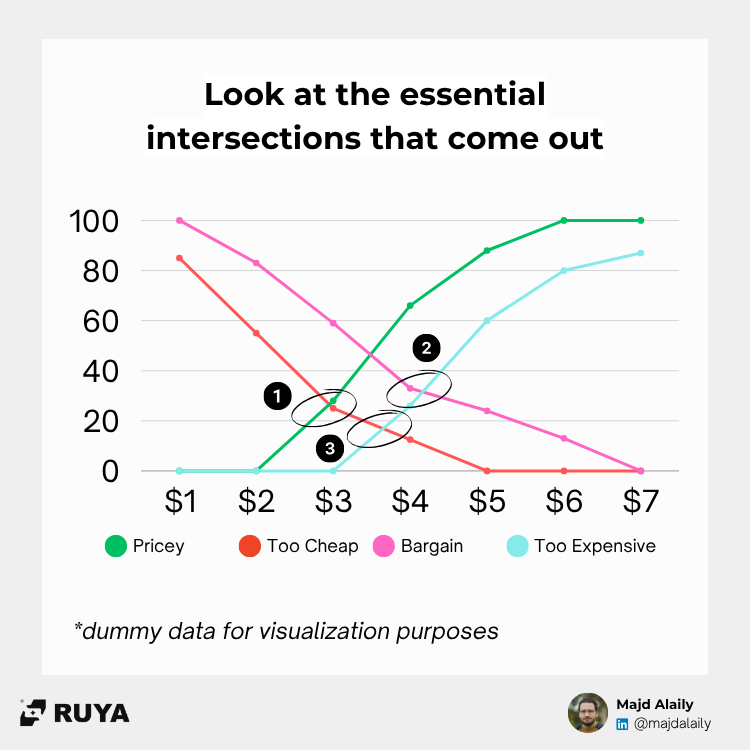
(1) Point of Marginal Cheapness (PMC)
Where “Too Cheap” and “Expensive but Worth It” intersect.
Below this price, customers start to doubt your quality.Meaning: Below this price, you risk losing the majority of your sales because customers perceive your product to be low in quality.
(2) Point of Marginal Expensiveness (PME)
Where “Bargain” and “Too Expensive” intersect.
Above this price, you risk losing customers due to sticker shock.Meaning: Above this price, you risk losing the majority of your sales because customers perceive your product too expensive to consider.
(3) Optimal Price Point (OPP)
Where “Too Cheap” and “Too Expensive” intersect.
This is the sweet spot — a balance between perceived value and cost.Meaning: The OPP reflects a balance between perceived value and cost. The majority of customers feel the product is neither overpriced nor undervalued.
3. Determine your (initial) pricing:

Your acceptable price range sits between PMC and PME.
Too low? You erode trust.
Too high? You limit reach.
BUT… there are limitations to keep in mind
This model is powerful, but not perfect. Remember that Van Westendorp:
Doesn’t factor in competition (what similar products cost) and customers evaluates your product in a “vacuum”.
Doesn’t reflect your cost structure or desired margins.
Assumes users can accurately judge value (not always the case).
Doesn’t reflect how your offering is evolving over time.
But despite all that, it’s a great starting point, especially if you're launching something new, experimenting with pricing, or trying to escape the “guess and hope” trap.
Instead of going with pure “gut feel”, or copying competition, this model helps you set a baseline of where to start.
Your pricing will then continue refining and evolving over time, as you learn more about your client, the market, and your own value proposition.
Action items for you
Run the survey with at least 30 potential customers or leads.
Plot the results, identify the intersections (PMC, PME, OPP).
Define your range between PMC and PME.
Test different price points within this range and track conversion + feedback.
Refine as you go, adjust based on competition, margins, and real-world results.
When was the last time you revisited your pricing?
And did you use data, or just guess?
Let’s get to work, Majd
P.S: Enjoying the content? Why don’t you subscribe and get an awesome tip every week?
More?
Hi, I’m Majd. I help early-stage founders build, go-to-market, and fundraise for their ventures. Here’s how I can support you:
Daily Insights: Follow me on LinkedIn for startup strategies, tips, and real-world tactics
Free Report: Try the Problem-Solution Pulse: get an 11-page personalized breakdown of your startup's foundation.
Advisory Support: Explore Ruya Advisory to see how we can work together 1:1 or through founder programs.